"AN INVESTMENT IN KNOWLEDGE ALWAYS PAYS THE BEST INTEREST" BENJAMIN FRANKLIN
"AN INVESTMENT IN KNOWLEDGE ALWAYS PAYS THE BEST INTEREST" BENJAMIN FRANKLIN

Research Article - (2022) Volume 59, Issue 2
Received: Mar 31, 2022, Manuscript No. BSSJAR-22-59167; Editor assigned: Apr 04, 2022, Pre QC No. BSSJAR-22-59167; Reviewed: Apr 14, 2022, QC No. BSSJAR-22-59167; Revised: Apr 18, 2022, Manuscript No. BSSJAR-22-59167; Published: Apr 25, 2022, DOI: 10.36962/GBSSJAR/59.2.006
The structural transformation across the economic sectors is one of the prominent features that go together with economic development. The paper scrutinizes whether developing and low-income countries follow a similar path and pattern of structural transformation by which the developed countries are following or following this threshold and are now experiencing a shift from the industrial sector to the service sector. The structural transformation paths of developed countries are almost identical, but the pattern of sectoral output shares varies from that of developing countries. The research reveals a fascinating finding i.e., low-income countries outperform middle-income countries and some major countries in terms of the pace of structural transformation from agriculture to the service sector.
Structural change, Structural transformation, Sectoral output share, Gross domestic product, Developed countries, Developing countries.
Economists have explored a statistical connection between a country's production and occupation systems and its level of economic growth. In his seminal work "The Conditions of Economic Progress," Colin Clark writes: “as time goes on and communities become more economically advanced, the numbers engaged in agriculture tend to decline relative to the numbers in manufacture, which, in turn, decline relative to the numbers engaged in services” (Clark 1951). Clark developed the fundamental theoretical relationships that would later become the cornerstone of structural change theory (Syrquin 1988). Simon Kuznets explored the Clark-Fisher theory empirically in his document and analyzed that structural transformation plays an integral role in the process of modern economic growth among developing countries. In one of the characteristics of modern economic growth, Kuznets summarized that “the rate of structural transformation of the economy is high” (Kuznets 1973). For Kuznets and more generally in economic history and development, growth and structural transition are inextricably linked. Major aspects of structural change of an economy take place mainly along two dimensions, the reallocation of transformation from agricultural to non-agricultural stalking and industry to services.
Economies evolve, not only in terms of growth but also in terms of structure. While economic theory recognizes the connection between economic growth and structural changes, the issue of whether economic growth induces structural changes or structural changes triggers aggregate growth. A strong causal relationship occurs between economic growth and structural changes among developed countries by using a panel Granger-causality analysis of eight transition countries (Olczyk and Kordalska 2018). In contrast to developed countries, emerging countries take very differently institutional transition directions. Asia is on a glide path that is most similar to that of developed countries (Bah 2011). Due to economic reforms, the economies of India and China are increasing rapidly among Asian countries. During the period 1993 to 2010, both the economies as a whole and the activities in terms of employment are moving away from the main sector towards the secondary and service sector (Mallick 2017).
The study explores the distributional issues of structural changes among different countries within and outside the Asian continent from 1991 to 2018. The analysis covers seven Asian developed and developing countries: China, India, Pakistan, Japan, Indonesia, Arab World, the South Asian Group and three other country groups: High, Middle and Low Income countries by World Development Indicators (2010). In this paper, we conduct a detailed analysis that compares the structural transformation process among the selected countries, whether developing and low-income countries follow a similar path and pattern of structural transformation by which the developed countries have crossed this threshold and are now experiencing a shift from industry to service sector. The reallocation of resources across sectors is one of the prominent features that go together with development. The paper will address the key issues of structural change that varies across different country groups. The paper is divided into five sections, section I includes the brief introduction and literature of this study. Section II includes the data and methodology used in this study. Section III deals with the paths of structural transformation using the Michaely Index. Polynomial functions of sectoral output shares are presented in section IV of the study and section V is providing the overview findings of the study.
Data and methodology
We evaluate the relative performance of selected countries on structural change and economic growth and examine whether developing and low-income countries follow the same pattern of economic transformation over the period. The study uses time-series data at the national level of each country group collected from World Development Indicators based on (2010) constant prices in dollar terms. To condense the complexity of data we first start the conversion of actual data into billions for further analyses in a smooth way. The pattern of structural change and economic growth is studied by examining the log of GDP and sectoral output shares (Agricultural, Industry and Service) across country groups from 1991 to 2018.
For a structural change, the Norm of Absolute Values (NAV) is estimated, also known as Structural Change Index (SCI) or Michaely Index (MI) across the country groups (Michaely 1962, Cortuk and Singh 2011).
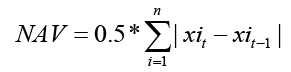
Where xit and xit-1 is the sectoral contribution of sectors ‘i’ at the time‘t’, ‘i’ indicates the sectors 1,2 and 3: agriculture, industry and services. The value of SCI ranges from ‘0 to 100’ where the value of ‘0’ (Zero) indicates no structural change and ‘100’ indicates a highest structural change of a particular sector in a particular country.
Multi polynomial regression is used to fit the relationship between sectoral output shares and Gross Domestic Product (GDP) for all countries and country groups. The degree of the polynomial is determined by the goodness of fit. To reduce the likelihood of getting a warning message covering the collinearity among predictors, the mean centre is estimated from the independent variable (log GDP). The mean centre is the actual deviation which is taken from the actual mean of all country groups, expressed as:
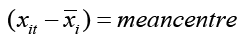
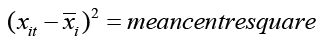
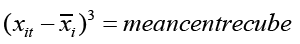
Where Xit is the value of an independent variable (log GDP) of country ‘i’, at the time‘t’, and is the actual mean of country groups. Starting from a linear polynomial with log GDP, and mean-centred, variables at power 2 and 3 as independent variables, the degree was increased by 1 and continued the process until we find a suitable model which fits the data. Both the linear and quadratic polynomial function with independent variables (log GDP and log GDP mean-centred variable at power 2) was found statistically insignificant and doesn’t fit the data. So, the log GDP mean-centred variable at power 3 (loggdpmcube) became the new independent variable that survived on the Durbin-Watson test.
For each sector, we estimated the following regression equation:
Where  is the sectoral output share and
  is the log GDP mean cube (log GDP mean-centred at power 3) for country ‘i’ in period‘t’, and
  are the regression coefficients
This section analyzes the pattern of structural change among the country groups, whether developing countries have a similar structural transformation path followed by developed or high-income countries. The analysis covers the ten countries based on the economic transition away from the primary sector to the industrial sector and later to the service sector. The yearly estimated Norm of Absolute Values (NAV) is categorized in panel data set by averaging to obtain time series of five intervals from 1992 to 2018 consisting of ten country groups into six cross-sections. The whole data set was incomprehensible to interpret on a single desk or slot. For its better understanding, the countries were restructured into three groups. The group first includes the individual countries like China, Japan, India, Indonesia and Pakistan ranked by the strength of GDP. Group second includes the country groups of the Arab World and South Asia and group third includes all the countries within or outside the Asian continent, to make the analysis more comparative. The group third includes the High-, Middle- and Low-income countries based on World Development Indicators.
The figures (Group 1st,2nd and 3rd) are plotted on the average sectoral output share of Norm of Absolute Values among the country groups, which are categorized by the strength of GDP based on World Development Indicators. It can be observed from the analysis, that the developing and low-income countries are not following the same path of economic transition by which developed and high-income countries have spanned or voyaged. Hence, it's mainly based on the capabilities of the economy's sectoral dominance, which wrenches the possessions from unproductive sectors to productive sectors. The structural transformation path in Japan, Arab World and High-income countries are almost similar, but the economic structure among these countries is not the same. The reallocation of sectoral share is shifting away from the primary sector to the service sector more than the industrial sector. If we look at the contribution of sectors to the aggregate gross domestic product at the same duration, the contribution of the industry sector among these countries to the aggregate GDP is much less than the service sector. India and South Asia have had the same economic transition over the period after globalization. The structural transformation has been moving from the primary sector to the service sector with a simultaneously marginal increase in the industry sector. The same pattern of structural transformation is found in both Pakistan and South Asian Countries. In other words, we can say these countries are near to the second stage of Kuznets’s hypothesis of the second dimension of the structural change theory. China, Indonesia and Low-income countries are following the analogous structural transformation process with each other, where the reallocation is shifted away from the primary sector to the industrial sector ahead of the service sector that is what Kuznets called it first stage of structural change theory (Figures 1-3).

Figure 1: The structural transformation path in China, Japan, India, Indonesia and Pakistan. Note: 


Figure 2: The structural transformation path in Arab world and South Asia. Note: (NAV)
(NAV)

Figure 3: The structural transformation path of High Income Countries, Middle Income Countries and Low Income Countries. 
It has been generalized that the economic transition path followed by selected country groups was invariantly changing over the period after globalization. The mean of the norm of absolute values of five intervals is not consistent throughout the country groups so we can say the developing, middle- and low-income countries are following a similar pattern of structural transformation process by which developed ones have crossed or crossed. It needs another study that can identify how far the economic transitions differ or are similar among the economies. To authenticate the means of Structural Change Index values which are taken for the analysis of the structural transformation path among the country groups, we applied Levene’s test of equality of error variances and Post-Hoc Tests to the means of the norm of absolute values for the identification of null hypothesis. The null hypothesis reads as  (the structural transformation path among the different counties is similar) that is, the means (μ) of NAV is equal across the country groups.
Levene’s test will validate the error variance of the means of the Structural Change Index is equal across the groups, then the country groups are following a systematic pattern of structural transformation. The Levene’s test (0.051) shows the significance level of homogeneity and the mean variances are statistically survived at the 5% level of significance (F = 0.004). the structural transformation path among the selected country groups differs significantly, as the error variance of the average means of Norm of Absolute Values (NAV) is not equal across groups. The Levene’s and ANOVA tests are limited only to the overall differences between the groups, but it does not tell us which specific groups differed-Post-Hoc tests do. The Post-Hoc Test gives multiple comparisons across the country groups based on observed means. It is analyzed that the economic transitions between the country groups like Arab World and High-income countries (0.04), Arab World and Middle-income countries (0.03), High-income countries and India (0.03) and India and Middle-income countries (0.01) are statistically significant at 5% level of significance by Post-Hoc test validation. The structural transformation path among the countries has been found statistically different in some countries mentioned above and in some countries the path is similar. The next section analyses, how far the structural transformation path among the country groups varies with the strength of economies.
Polynomial analysis
The economic transformation of sectoral output shares is a crucial consistency of the data across the countries. Even though the rate of structural change varies by country and country groups, they all share the same characteristics: the share of agriculture in output declines, with the increase in GDP, the share of industry increases initially and subsequently decreases and the share of services increases steadily. Polynomial regression is estimated to fit the relationship between the sectoral output and GDP across the country and country groups. As mentioned above in the methodology section, the degree of the polynomial is determined by the goodness of fit, so adjusted R squared has to be taken into consideration instead of R squared. Adjusted R squared is a better model evaluator and can correlate the variables more efficiently than R squared. (Tables 1 and 2) represents the regression results across the countries and country groups with adjusted R squared. For all the countries and country groups, third-degree polynomial functions are best fitted across the sectors (agriculture, industry and services) except Japan in the industry sector as the change in the adjusted R square is (-0.02) from quadratic to cubic model (insignificant at 5% and significant at 10% level of significance) and high-income countries in agriculture and service sector as the change in adjusted R2 is (-0.01) from log GDP2 to log GDP3 (both are significant at 5%).
| log GDP (Linear) | log GDP (Quadratic) | log GDP (Cubic) | ||||||||
|---|---|---|---|---|---|---|---|---|---|---|
| Economies | Sectors | B | Adj.R2 | Sig. | B | Adj.R2 | Sig. | B | Adj.R2 | Sig. |
| China | Agriculture | 0.13 | 0.83 | 0 | 0.26 | 0.9 | 0 | 0.43 | 0.93 | 0 |
| Industry | 0.33 | 0.75 | 0 | 0.75 | 0.87 | 0 | 1.26 | 0.91 | 0 | |
| Services | 0.32 | 0.78 | 0 | 0.7 | 0.88 | 0 | 1.21 | 0.92 | 0 | |
| India | Agriculture | 0.84 | 0.83 | 0 | 0.92 | 0.84 | 0 | 1.29 | 0.89 | 0 |
| Industry | 1.86 | 0.78 | 0 | 2.08 | 0.81 | 0 | 2.95 | 0.86 | 0 | |
| Services | 2.15 | 0.82 | 0 | 2.38 | 0.84 | 0 | 3.4 | 0.9 | 0 | |
| Indonesia | Agriculture | 2.47 | 0.79 | 0 | 2.92 | 0.8 | 0 | 3.74 | 0.86 | 0 |
| Industry | 3.11 | 0.8 | 0 | 4.11 | 0.87 | 0 | 4.81 | 0.9 | 0 | |
| Services | 4.26 | 0.77 | 0 | 5.12 | 0.79 | 0 | 6.57 | 0.85 | 0 | |
| Japan | Agriculture | -177.19 | 0.5 | 0 | -174 | 0.54 | 0 | -294.91 | 0.59 | 0 |
| Industry | 78.32 | 0.46 | 0 | 76.6 | 0.55 | 0 | 73.41 | 0.53 | 0.06 | |
| Services | 114.9 | 0.63 | 0 | 115.9 | 0.64 | 0 | 233.74 | 0.81 | 0 | |
| Pakistan | Agriculture | 3.36 | 0.73 | 0 | 4.43 | 0.85 | 0 | 5.28 | 0.87 | 0 |
| Industry | 5.16 | 0.71 | 0 | 6.44 | 0.77 | 0 | 8.16 | 0.81 | 0 | |
| Services | 5.25 | 0.78 | 0 | 6.38 | 0.83 | 0 | 8.08 | 0.87 | 0 |
Table 1. Regression results for individual countries
So for them, the quadratic polynomials are best fitted with an adjusted R2 equal to 0.55 and 0.83 (agriculture sector) and 0.88 (service sector) respectively.
The rate of structural transformation from the agriculture sector to the service sector among the individual country group is highest in Japan reported in Table 1. The regression coefficient of Japan at the third-degree polynomial (log GDP3) in the agriculture sector is negative (-294.91) and the service sector is dominating sector partaking the value of 233.74 with adjusted R squared equal to 0.88, having the minimal contribution of the industrial sector (76.60 and adjusted R2 equals to 0.55) at second-degree of best fit in the pattern of sectoral output shares with the increase in GDP. China and Pakistan are following a similar pattern of structural transformation as the share of sectoral output is moving towards the industrial sector more than the service sector at the third degree of polynomial functions. The regression coefficients in both the countries are higher in the industrial sector (1.26 and 8.16) than the service sector (1.21 and 8.08) with adjusted R squared equals to (China-ind. 0.91 and ser. 0.92 and Pakistan-ind. 0.81 and ser. 0.87) respectively reported in Table 1. The share of the service sector is more in India and Indonesia with the increase in GDP as the coefficients are greater in the service sector than in other sectors explained by more than 85% by adjusted R squared.
Arab World and High-income countries are persuading more towards the service sectors, double transformation rate from the agriculture to the service sector reported in Table 2. Thus, this pattern differs from that of individual country groups except Japan in the level of dimensions. The analysis shows that High-income countries fit at the second-degree of polynomial regression with adjusted R squared is more than the log GDP3 in the agriculture and service sector and the same in the industry sector. Low-income countries (regression coefficient is 6.69) are showing a surpassing pattern of structural transformation over the Middle-income countries (5.24) and South Asia (3.66) country groups as the speed of third-degree polynomial is more from the agriculture sector to the service sector with adjusted R2 equals 0.90, 0.91 and 0.89, respectively. The process in each of the three countries (Japan, Arab World and High-Income countries) represents a particular pattern of structural transformation that is followed by other countries except Pakistan and China, where the structural transformation rate is more towards the industrial sector with the strength of the GDP. The analysis of the sectoral output shares revealed that the service sector is gradually increasing among the countries or country groups except countries mentioned above, but they differ at the level of structural transformation dimensions. The regressions for all the countries vary between the countries with adjusted R2 exhibiting huge deviations in the rate of structural transformation. From the (Tables 1 and 2) the coefficients of the service sector with the log GDP3 are approximately similar in India (3.40), South Asia (3.66) and Middle-income countries (5.24) with adjusted R squared equals 0.90, 0.89 and 0.91, respectively. Low-income countries and Indonesia are sharing the close transformation pattern in all the sectors at three-degree polynomial functions stated in (Tables 1 and 2). The analysis above shows that structural transformation in developing countries is differing what is followed by developed countries, but the path among some countries is similar.
| log GDP (Linear) | log GDP (Quadratic) | log GDP (Cubic) | ||||||||
|---|---|---|---|---|---|---|---|---|---|---|
| Economies | Sectors | B | Adj.R2 | Sig. | B | Adj.R2 | Sig. | B | Adj.R2 | Sig. |
| Arab world | Agriculture | 3.47 | 0.78 | 0 | 8.48 | 0.93 | 0 | 13.23 | 0.97 | 0 |
| Industry | 3.7 | 0.79 | 0 | 8.32 | 0.9 | 0 | 13.32 | 0.94 | 0 | |
| Services | 6.18 | 0.71 | 0 | 15.71 | 0.86 | 0 | 28.05 | 0.94 | 0 | |
| South asia | Agriculture | 1 | 0.82 | 0 | 1.12 | 0.84 | 0 | 1.54 | 0.89 | 0 |
| Industry | 2.15 | 0.78 | 0 | 2.45 | 0.81 | 0 | 3.37 | 0.86 | 0 | |
| Services | 2.34 | 0.81 | 0 | 2.63 | 0.84 | 0 | 3.66 | 0.89 | 0 | |
| High income countries | Agriculture | 11.45 | 0.69 | 0 | 21.01 | 0.83 | 0 | 21.07 | 0.81 | 0 |
| Industry | 15.74 | 0.69 | 0 | 27.89 | 0.8 | 0 | 28.62 | 0.8 | 0 | |
| Services | 25.11 | 0.69 | 0 | 49.47 | 0.88 | 0 | 49.99 | 0.87 | 0 | |
| Middle income countries | Agriculture | 2.13 | 0.87 | 0 | 2.39 | 0.89 | 0 | 3.08 | 0.93 | 0 |
| Industry | 3.43 | 0.84 | 0 | 3.88 | 0.86 | 0 | 5.14 | 0.9 | 0 | |
| Services | 3.53 | 0.84 | 0 | 3.92 | 0.86 | 0 | 5.24 | 0.91 | 0 | |
| Low income countries | Agriculture | 2.83 | 0.86 | 0 | 3.45 | 0.91 | 0 | 3.96 | 0.93 | 0 |
| Industry | 3.63 | 0.83 | 0 | 4.38 | 0.87 | 0 | 5.12 | 0.89 | 0 | |
| Services | 4.62 | 0.83 | 0 | 5.52 | 0.87 | 0 | 6.69 | 0.9 | 0 |
Table 2. Regression results for all country groups
The paper analyzed the structural transformation pattern among the countries and country groups, covers seven Asian developed and developing countries: China, India, Pakistan, Japan, Indonesia, Arab World, South Asian Group and three other country groups: High-, Middle- and Low-Income countries classified by World Development Indicators. Contrary to developed countries like Japan, Arab World and High-income countries, developing countries follow a distinct path of structural transformation. The structural transformation pattern among the countries was analyzed by two different methodological approaches: The Michaely Index and Polynomial functions and both the approaches concluded almost the same pattern of transformation among the countries. In section II, the paths of transformation are almost similar in Japan, the Arab world and High-income countries. A key feature of these countries is high service output shares with the increase in GDP. India, South Asia and Middle-income countries also share a similar Norm of Absolute Values contrary to China, Indonesia, Pakistan and Low-income countries and was found statistically significant while using Levene’s and Post-Hoc tests.The service sector is a major contributor to the economic structural change, and it grew faster in Japan, Arab World and High-income countries and country groups. Among all the countries, Pakistan and China are the only countries where structural transformation is moving more towards the industrial sector than the service sector. Low-income countries and Indonesia are on the same path on structural transformation rate. The main finding of the paper is, not all developing countries have the same path of structural transformation as which developed countries are passing. But the pattern of sectoral output shares or the shift from the agriculture sector to the industrial sector and from the former to the service sector is almost similar among the developing countries.
Availability of data and materials
Data analysed in this study is available online from world development indicators:
https://databank.worldbank.org/source/world-development-indicators
Ethics approval and consent to participate
All the participants that helped in this study did so willingly.
Consent for publication
The authors agreed to have this paper published.
Competing interests
The authors declare that they have no competing interests
Funding
This study is self-funded as it is part of a PhD thesis with Annamalai University, Chidambaram.
Authors' contributions
This paper is part of a PhD thesis by Altaf Hussain Padder, supervised by Dr B Mathavan who helped significantly in preparing the article.
Acknowledgements
I appreciate the support and inspiration I was given by my research guide Professor and Co-Ordinator Economics Wing DDE, Annamalai University-Dr B Mathavan